My “Woodstock” The summer of 1969 through the eyes of an undergraduate physics major
Fall
2021
Feature
My “Woodstock” The summer of 1969 through the eyes of an undergraduate physics major
David M. Pepper, Owner, Physicist, Inventor, and Consultant, Malibu Photonics
Ever since I was a kid at Hancock Park Elementary School in Los Angeles during the 1950s, I have loved science. I watched Mr. Wizard on TV and read his newsletters, got monthly “Things of Science” experiments by mail, looked at “The Amateur Scientist” in Scientific American, and read science books for kids by science writer Kenneth Swezey.
My teacher allowed me to perform science experiments in front of my classmates in the fourth grade, the year 1959. They called me “the scientist.” In one experiment I built a cloud chamber—using dry ice and a jar of saturated alcohol—to view cosmic ray tracks (elementary particle tracks). Unfortunately, the experiment didn’t work, but I freaked out my classmates by placing small chunks of dry ice in the boys’ bathroom toilets. Needless to say, I met the principal that day!
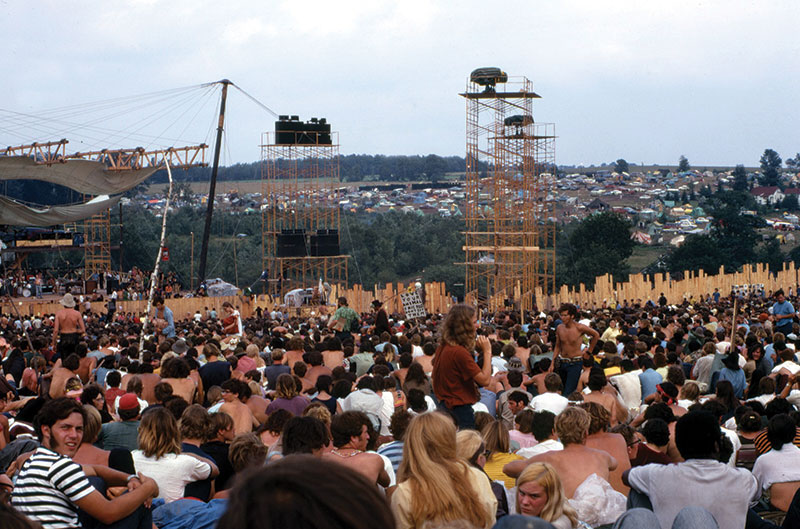
Just 10 years after my unsuccessful cloud chamber experiment, I would find myself at the frontier of physics, performing experiments on elementary particles at SLAC. From Woodstock, Vietnam, and Nixon to the Beatles and the Stones, the Apollo 11 lunar landing, and the World Champion Mets and Jets, 1969 was a dynamic year. As music rocked Woodstock, I would be having an unforgettable, incredible summer at one of the world’s most powerful accelerators. It was my Woodstock.
Spring of 1969
After graduating from Fairfax High School and completing two years at Los Angeles City College, I transferred to UCLA to complete my bachelor’s degree in physics. It was the spring of 1969, and I wanted to work in the physics department for the summer. I had just aced Physics 105A, Classical Mechanics, taught by (the late) Professor Darrell Drickey. I scheduled an appointment and asked him if there was anything I could do over the next three months.
I had zero ideas about current research. Wasn’t everything already discovered and investigated? What was left to do in mechanics, thermodynamics, electricity and magnetism, or optics? And I hadn’t yet heard of quantum mechanics. Maybe I could clean test tubes or measure the Q of oscillators?
Professor Drickey sensed my naïveté and invited me to spend the summer at SLAC doing high-energy physics. I had no idea what SLAC was or what high-energy physics entailed, and I had never lived anywhere but with my parents. Professor Drickey suggested that I pack my bags, drive up to Stanford, and help run an experiment to uncover the physics of the neutral K-meson (K0) decay . . . whatever that was!1 How exciting and scary—to leave home and do something when I had no idea as to its meaning (remember, this was more than 25 years before Google and smart phones!).
Two weeks later, my mom was waving goodbye in my rearview mirror as I drove north in my 1967 Mustang. A nice lady named Mrs. McKay rented rooms to summer students in her turn-of-the-century, multibedroom house in Palo Alto. She became my second mom that summer.
Day 1
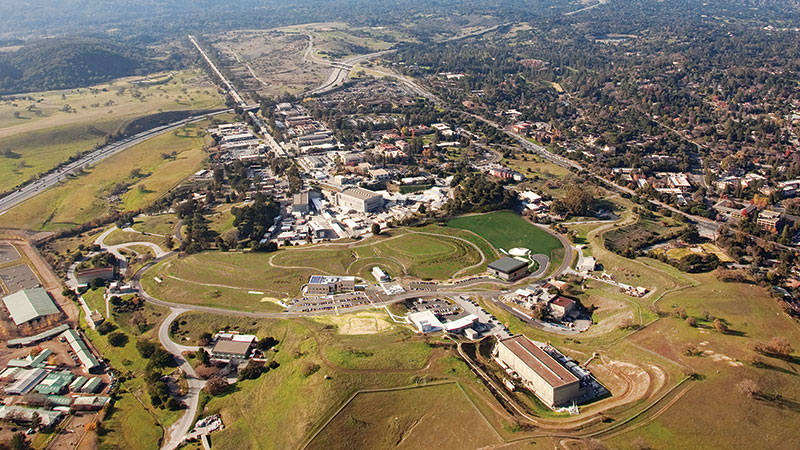
As I drove into work on my first day, a sign said that SLAC was administered by the AEC, the Atomic Energy Commission. This would bring Vietnam protesters to picket in front of the facility, believing it was home to atom bomb research. At the time, SLAC stood for the Stanford Linear Accelerator Center. The facility is now the SLAC National Accelerator Laboratory, administered by the US Department of Energy.
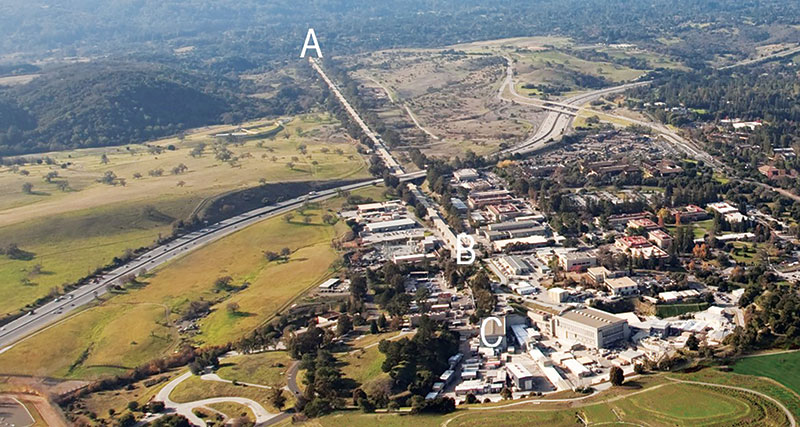
The main facility consisted of a two-mile-long electron accelerator housed in a kind of copper tube, under high vacuum, buried 30 feet underground and aligned to within fractions of a millimeter of a straight line. The final electron beam energy was 16 GeV (GeV = one billion electron volts), the world’s highest energy electron beam at the time. At the end of the accelerator was a collection of concrete buildings, called end stations, that held experiments performed by international collaborations. A “switchyard” directed the beam to the various experiments in the yard. Our experiment would take place in End Station B.
I met the team members that first day: physics faculty members from UCLA, Johns Hopkins University, the University of Greece, and the Naval Post-Graduate School in Monterey, among others. I had a vantage point from the shoulders of giants that summer—I came in knowing nothing about quantum mechanics or particle physics.
The experiment
I learned quickly and soaked up the physics. In End Station B, the 16-GeV electron beam collided with a block of beryllium (Be). This collision produced a plethora of subatomic particles—protons, neutrons, electrons, and an alphabet soup of mesons—that entered a second concrete room where our experimental apparatus was housed. That’s where the fun started!
The goal of the experiment was to investigate the physics of a neutral elementary particle, the K-meson, to determine its so-called form factor.1,2 As it travels, the K-meson decays into various other elementary particles. We studied a specific set of decay modes.
The decay of a neutral K-meson to a positively charged pi-meson (π+), an electron (e-), or a muon (µ-), and the corresponding neutral and nearly massless neutrino (the electron neutrino, νe, or the muon neutrino, νµ), as well as its antiparticle counterparts π-, e+, or μ+ and the respective antineutrino.
The decay of the neutral K-meson to a π+, π- and neutral pi-meson, π0.
The former, which is discussed in this article, is analogous to a cue ball (the K-meson) spontaneously fragmenting into three new billiard balls: a pi-meson, an electron (or a muon), and a neutrino.
There were two different types of neutral K-mesons generated by the Be collision: the so-called K-zero-long (K0L) and K-zero-short (K0S), with decay times of 50 ns and 90 ps, respectively. Our detector was in a building a distance from End Station B such that the K0S mesons would have long since decayed and we could investigate primarily the K0L mesons. Isn’t nature wonderful?!
Our apparatus
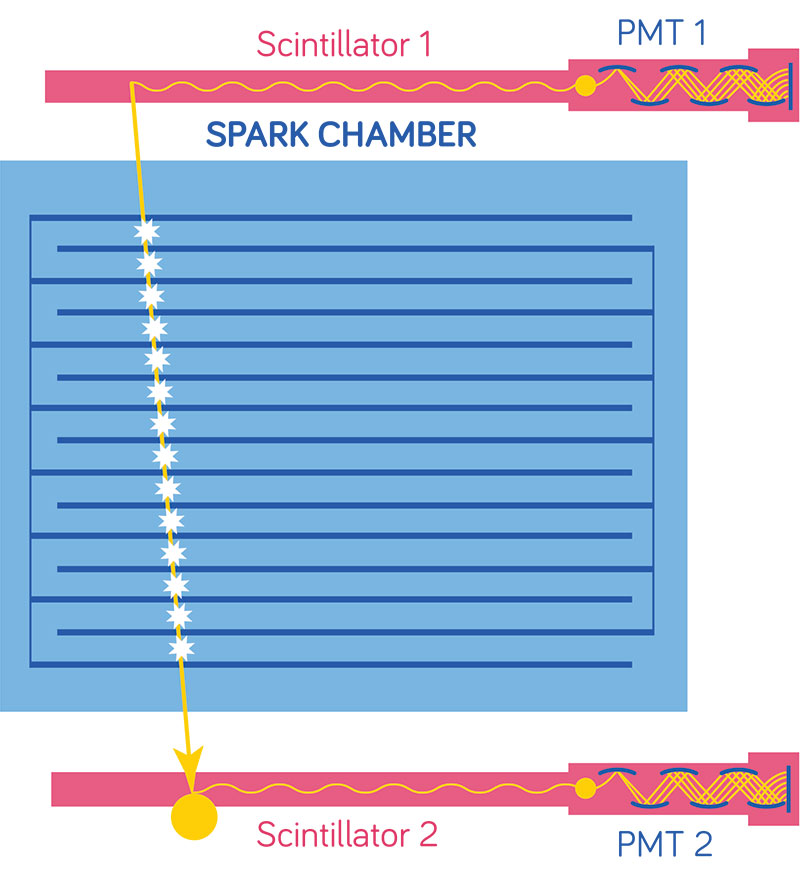
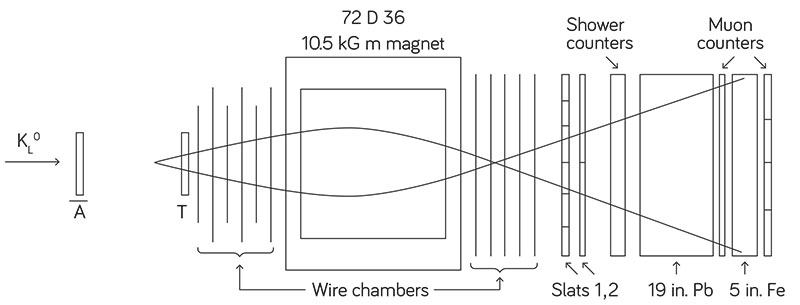
Our basic apparatus consisted of two sets of so-called spark chambers (wire chambers) that sandwiched a magnet about 30,000 times stronger than the Earth’s magnetic field. Each spark chamber consisted of a thin layer of gas—a mixture of helium-neon atoms—bound by screens; it looked like a thin window with screens on both sides. When a charged particle traversed a spark chamber, it left a track of ionized gas that sparked when there was a voltage pulse across the chamber. The coordinates of the spark (and, hence, the location of the charged particle) were determined by which wires carried the current pulse.
Imagine throwing a baseball through a sequence of windows, creating a hole in each window. The path of the holes in the windows reflects the baseball’s trajectory. Similarly, the path of the sparks in the chambers reflected the charged particle’s trajectory. Using a 3D reconstruction code, we could connect the sparks to reveal a particle’s trajectory.
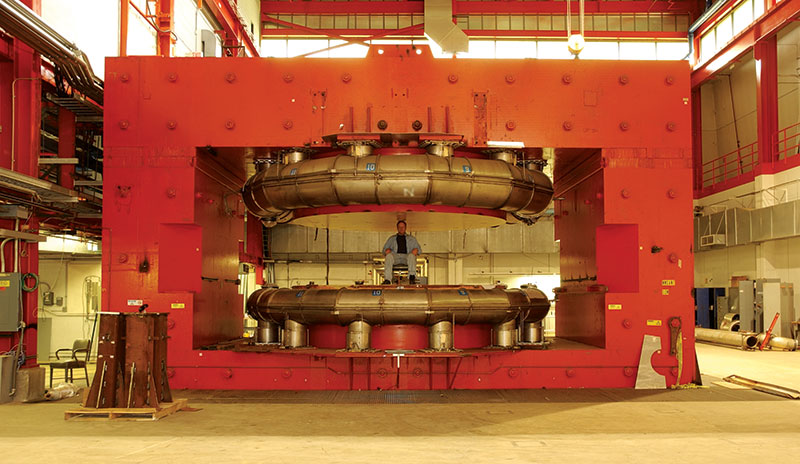
After passing through the first array of spark chambers, the particles traveled through the magnet. A magnetic field curves the path of charged particles—positively charged particles curve opposite to negatively charged particles, while neutral particles are unaffected. The greater the momentum of a particle, the less the magnet curves its path. A second set of spark chambers came after the magnet so we could collect curvature data. From this we could determine the momentum and charge of a particle.
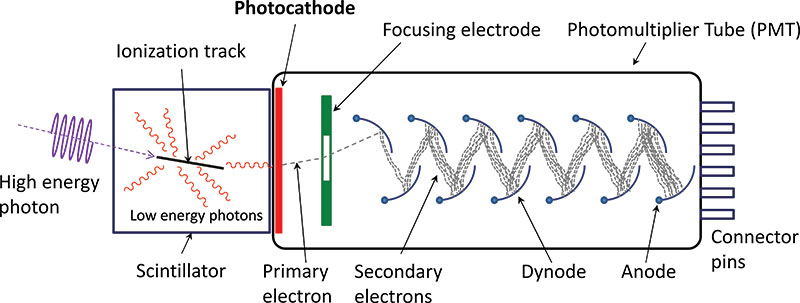
Next, the particles passed through scintillator detectors arranged in crisscrossed slats to create a checkerboard pattern. A scintillator is a material that emits a pulse of visible light in response to high-energy radiation. In scintillator detectors, this pulse of light is captured, amplified, and outputted by a photomultiplier tube (PMT). Since photomultiplier tubes are so sensitive to light, we wrapped the scintillator detectors in black tape. The tape didn’t impede the particle’s path but blocked the room light so that the scintillator was light-tight.
When a charged particle passed through a checkerboard square it generated a minute flash of light, a detectable pulsed signal; when a neutral particle passed through it left no signal. The K0L decays resulted in a pair of charged particles—a pion and either an electron or a muon—and a neutral neutrino, so a desired event triggered two squares simultaneously: one left of center and one right of center.
From there the particles encountered a so-called shower counter. Made of thin lead sheets (absorbers) and scintillator detectors, the shower counter differentiated electrons from other charged particles. Electrons generated a much larger “shower” of gamma rays and charged particles than pions and muons, which we could see in the PMT signals.
The final piece of the apparatus was a muon counter. This was comprised of a 19-inch-thick wall of lead bricks, a 5-inch-thick wall of iron, and scintillator detectors. The two walls blocked gamma rays and most charged particles, but not muons. The muons passing through were subsequently detected by scintillator detectors.
Data collection
The combination of signals from the checkerboard detector array and two scintillator detectors upstream of the spark chambers, noted as A and T, respectively, was digitally processed in a logic tree, thus determining which “events” to record and which events to discard. The space between scintillators A and T is where a K0L would decay from a neutral particle into charged particles.
For example, aK0L would not trigger A since it carries no charge; we’ll call this result [NOT A]. Once it decayed, the resulting charged particles would trigger the downstream detector T, yielding the result [T]. Because of their opposite charges, they would also trigger the left and right sides of the checkerboard array, namely, [Left] and [Right]. Hence, the combined triggers [NOT A] and [T] and [Left] and [Right] would indicate a K0L decay of interest.
Since the trigger scintillators, digitizing electronics, and logic gates performed much faster than the spark chambers, shower counters, and other pieces of the apparatus, there was adequate time to decide whether or not to record a given event using the logic tree. If yes, the spark-chamber coordinates, shower counter signals, and muon counter signals would be recorded, along with information for real-time beam monitoring.
Over the summers of 1969 and 1970, we recorded about 420,000 K0L events on magnetic tape. We used a Hewlett-Packard HP2116B computer—the company’s first computer, which was state of the art at that time. It used 16-bit words, had 16 kB of memory, and ran at a clock rate of 1 μs. It required large reels of magnetic tape to record the data. By comparison, a typical smartphone uses 32-bit or 64-bit words, has approximately 10 GB of memory, runs at a clock rate of 1 ns, and can record 1 TB of data on a thumb drive!
Conservation and form factors
The conservation of energy and momentum is a pillar of the physical laws. It can apply to billiard balls as well as to elementary particles. Using these conservation laws, all of the decay-mode products could be determined and tabulated for each event. Since the particles traveled at nearly the speed of light, the energy and momentum were relativistic in nature and Einstein’s famous equation, E=mc2, applied. It’s interesting that such basic physical laws apply to this otherwise complex system and apparatus.
To uncover the physics of the K0L meson decay, the team mapped various functions of the energies and momenta of the decay modes—the mass of the K0L, the energy/mass and momenta of the charged pion, the electron or muon, and the neutrino—in a two-dimensional plot. One important mapping was the Dalitz plot.3,4 On the Dalitz plot, each of our events was represented as a point, and the distribution of points indicated whether resonances, new particles, or form factors were present—a goal of the experiment.
In one case the distribution of the π, e [µ], and neutrino events (technically the square of the momentum transfer) was proportional to something called the strong interaction form factor. Determining form factors constitutes one of the key parameters of particle interactions.1 Experimental form factors can be compared against theory to test our understanding of the underlying physics and refine our models.1,2 As it turns out, the form factor was proportional to the shape and size of an elementary particle.2
This complex system is roughly equivalent to a cue ball (K0L) spontaneously fragmenting into three new billiard balls. Each such event results in a different energy distribution of the three balls, which also depends on the detailed shape of the billiard balls from purely spherical.
Detective work
During the summer months of 1969, the experiment ran over two-week periods, 24/7, after which we had a week to get ready for the next run. I worked the graveyard shift, from 4 a.m. to noon, with Professor Chuck Buchanan. I loved interacting with him, as he taught me the essence of the physics and how the system was calibrated. Many of his notes were written on the cardboard backing of notepads, the proverbial back-of-the-envelope, which I kept in my diary for posterity.
At one point, during a sequence of several days, we noted that the shower counter pulses from one of the detectors were abnormally high for an hour or so, so we had to scrap the data. I set out to determine the basis of this systematic problem. Eventually I noticed that shortly after sunrise each day, a sliver of sunlight entered the building and shone on the apparatus for about an hour. This sliver of sunlight hit the shower counters, whose PMTs were wrapped in black tape—but one PMT had a small opening in the tape. I was able to correlate the anomalous detector signal with that ray of morning sunlight! When I shared this with Professor Buchanan, he thanked me for my detective work. Even though I didn’t understand the detailed physics of the K-meson experiment, I took pride in preventing valuable data from being discarded: my moment of glory!
Summer’s end
That summer was so exciting and memorable that I captured it in the only diary that I ever created. The diary consisted of my layman’s description of the experiment and the basic underlying physics, as well as photos of the apparatus and gatherings that we had that summer. The physics team was like family to me, a very intimate, wonderful, and supportive group of faculty, postdocs, and students. I treasured the diary for decades and shared it with friends and colleagues.
Unfortunately, the diary and all my worldly possessions were lost in the Woolsey Fire of 2018. Still, the fond memories of that marvelous summer remain embedded in my memory.
Epilogue
After that wonderful experience, I returned to UCLA and became a junior member of the high-energy physics group, assisting with data analysis—think stacks of computer punch cards, huge tapes of data, and Fortran statements. The following summer I joined the group at SLAC for another two months of “phun” and physics in End Station B.
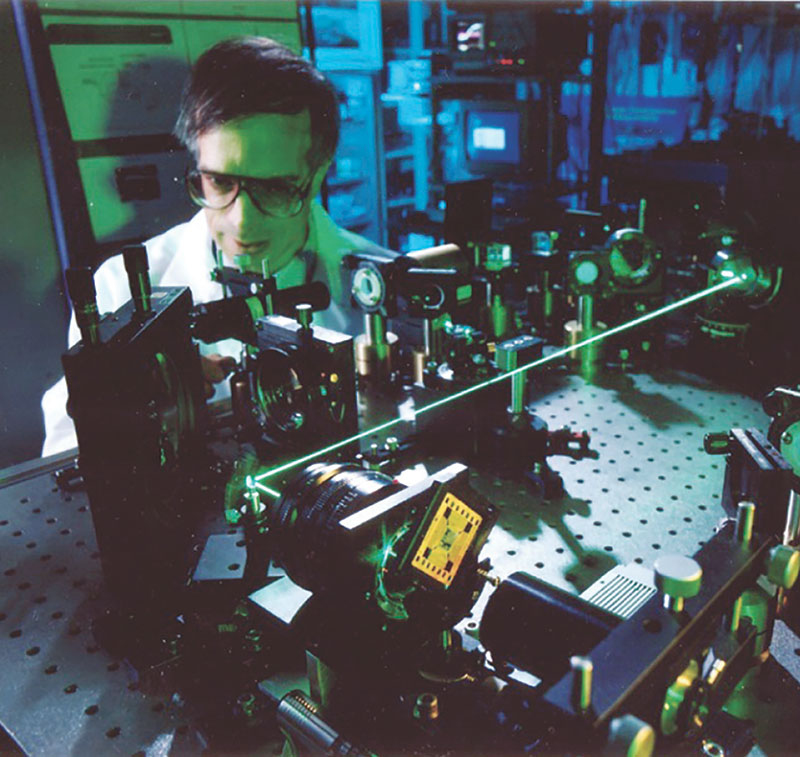
After earning my bachelor’s in physics from UCLA, I studied nonlinear optics at Caltech. My PhD thesis was in the emerging area of wavefront reversal, or phase conjugation, of laser beams. One can say that I went from one elementary particle (the K-meson) to another elementary particle (the photon).
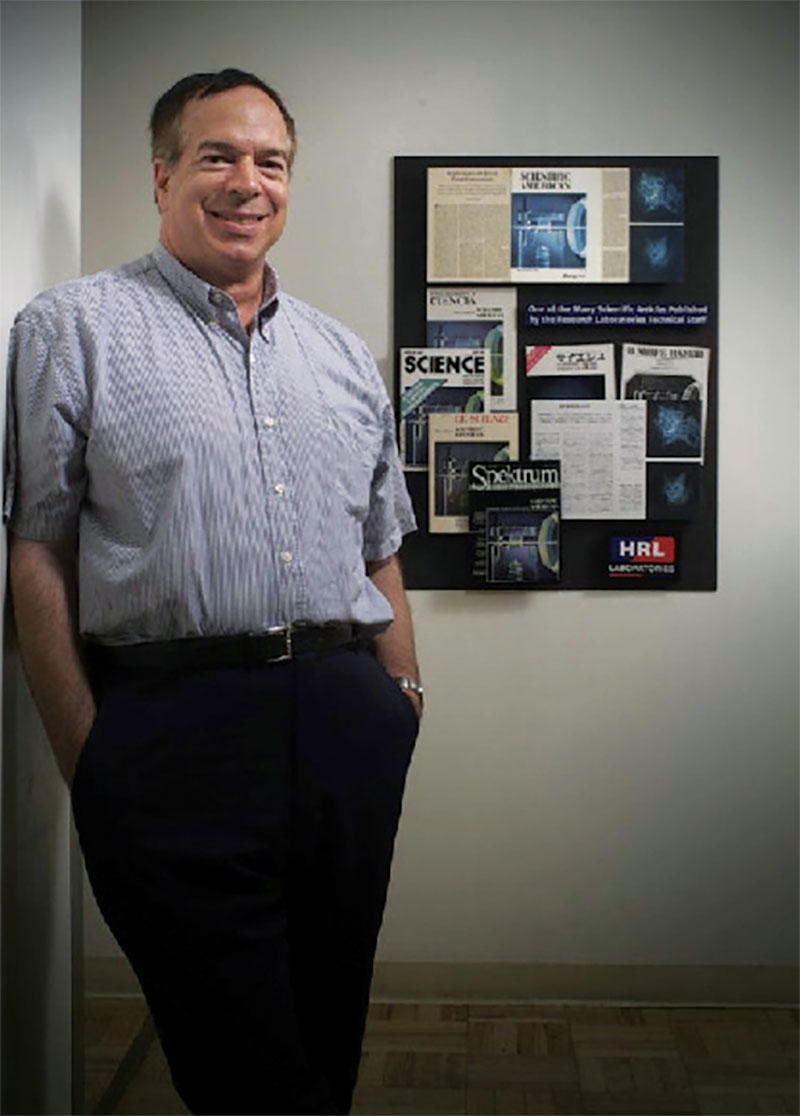
I had the honor to work at the Hughes Research Laboratories (now HRL Laboratories), where the world’s first laser, the ruby laser, was demonstrated by Ted Maiman in May of 1960. I spent my entire career at HRL working on such projects as phase-conjugate optics, adaptive optics, compensated imaging, laser-based ultrasound, and photonic communications. After retiring, I started Malibu Scientific, through which I do consulting on laser and photonics technology as well as intellectual property. I live with my dear wife, Denise, and our rescue doggie, Kirby.
Acknowledgments
I am forever grateful and thankful to my dear parents for providing me with the support and inspiration to pursue my dreams. Chuck” D. Buchanan and the late Professor Darrell J. Drickley became my mentors during my stay at SLAC and UCLA, and were very influential in my decision to pursue physics. I am truly indebted to them as teachers and as friends—their guidance was invaluable.
Notes
The summer of 1969 was truly a highlight of my life. The intent of this article is to express my excitement, enthusiasm, and inspiration for learning about what physicists do at a national laboratory, high-energy particle accelerators, the interactions of elementary particles, and this particular experiment. As such, the physics is written in layman’s terms through the eyes of a third-year undergraduate physics student and may not be 100% accurate.
- C. D. Buchanan, D. J. Drickey, D. M. Pepper, et al., “Study of Three-Body Charged Decays of K0L,” Phys. Rev. D 11 (February 1975): 457.
- For an early overview, see R. Wilson, “Form Factors of Elementary Particles,” Physics Today 22, no. 1, 47 (1969); physicstoday.scitation.org/doi/10.1063/1.3035356.
- See, e.g., Donald H. Perkins, Introduction to High Energy Physics, 3rd ed. (Menlo Park, CA: Addison-Wesley, 1987), Sec. 4.6.
- R. E. Mitchell et al. (CLEO Collaboration), “Dalitz Plot Analysis of D+s→K+K−π+,” Phys. Rev. D 79 (April 2009): 072008.
Share your undergraduate research story
Whether it was five months or 50 years ago, we’d love to hear about an undergraduate research experience that was meaningful to you! Submit stories, pictures, and/or reflections to sps [at] aip.org, and we may feature them in the Spring 2022 issue of Radiations.
